With the development and widespread use of high-throughput technologies in biomedical research over the past decade, there has been an exponential increase in the amount of omics data being generated. The increase in data generation, however, does not ensure easy accessibility and reusability. Currently, there are numerous data repositories (such as GEO - Gene Expression Omnibus, LINCS, TCGA, etc.) where researchers can store their data to facilitate reuse by other research groups. Owing to a lack of standardized protocols for data deposition in these repositories, data is often unstructured and hard to access. Consequently, a considerable amount of time has to be invested in cleaning and pre-processing the data before it can be used to gain new insights. Polly Discover presents a solution to these issues.
What is Discover?
Polly Discover is a centralized datalake containing curated multi-omics data from multiple publicly available data repositories. This data is stored in the form of individual data repositories to facilitate easy exploration and can be analyzed using various proprietary and open source applications on Polly, through Polly notebooks, and through a python SDK. In addition to public data, Discover also enables the analysis of proprietary data generated by the user. At present, Discover provides access to more than 150,000 unique datasets through repository-specific data lakes.
1. What is the curated data that exists in discover?
The number of public datasets that we add to our datalake is doubling every quarter and updated every day. As of March 16, 2021, Polly has around 150,000 unique datasets. These datasets are diverse in terms of the source public data repositories, omics, disease, drug, cell-line, and tissue being studied.
1.1 Organization of DataLakes on Polly
A data lake on Polly is a collection of datasets organized based on the source of the datasets (the corresponding public data repository). For example, the bulk Transcriptomics datasets in GEO are included in the GEO repository.
There are also some secondary categorizations of datasets based on diseases and tissues. There are various disease-specific and tissue-specific repositories on Polly which contain multi-omic data for those diseases and tissues from various sources.
These are the current disease and tissue-based datalakes (recorded in March 2021):-
-
AML: Microarray and RNA Sequencing datasets for Acute Myeloid Leukemia.
-
GBM: Microarray and RNA Sequencing datasets for Glioblastoma Multiforme.
-
IBD: Microarray and RNA Sequencing datasets for Inflammatory Bowel Disease.
-
Covid-19: Transcriptomics, Single-cell RNA Sequencing, Proteomics, Metabolomics and Lipidomics, datasets for COVID-19 (SARS-CoV-2).
1.2 What do we mean by curation of data in Polly?
Omics data in public and private repositories is often unstructured and not always analysis-ready. Researchers have to spend an enormous amount of time grappling with different file formats (CSV, Excel, GCT, Soft files, H5ad etc.) and different conventions for metadata representation.
Curation is the process of transforming this data into a consistent and machine-readable format and making it accessible on the platform. It is guided by the FAIR principles (Findable, Accessible, Interoperable and Re-usable) for scientific data management.
Datasets on Polly are stored in GCT (Gene Cluster Format from Broad Institute) files which allow for storing sample and molecular-level metadata in a single file. The only exception is single-cell data for which we use H5ad. We also make sure that consistent molecular identifiers are used across all data (e.g. we use HGNC symbols for all human transcriptomic data).
In addition to this, we append annotations to each dataset on Polly. These annotations on Polly are present at two levels. First, each file or dataset is designated descriptive metadata (dataset-level annotations). Second, each sample within each dataset is also annotated with relevant metadata (sample-level annotations). The annotations are generated through model-assisted labeling. We have an in-house team of expert curators who manually curate roughly 10% of all data. The labels generated during this process are used to train ML models which are then run on the remaining 90%.
1.2.1 Dataset-level annotations
Ontology mapping: Each dataset is mapped to terms in biomedical ontologies. Currently, we have 6 different types of mappings:
-
Organism: (NCBI Taxonomy) Organism from which the samples originated.
-
Disease: (MeSH) Disease(s) being studied in the experiment.
-
Tissue: (Brenda Tissue Ontology) The tissue from which the samples originated.
-
Cell type: (Cell Ontology) Cell type of the samples within the study.
-
Cell line: (The Cellosaurus) Cell line from which the samples were extracted.
-
Drug: (CHEBI) Drugs that have been used in the treatment of the samples or relate to the experiment in some other way.
Users can view and query dataset-level annotations both using discoverpy and the filtering interface.
These values are standardized across all datasets. The names of the ontologies we use are also mentioned above. The standardization of these fields is in line with FAIR guidelines for improving findability, interoperability, and re-usability. In particular, these annotations address the FAIR principles F2, F3 and I2 (see here for more details).
1.2.2 Sample-level annotations
Ontology Mapping: Similar to dataset-level ontology mappings, there are 5 sample-level mappings - Disease, Tissue, Cell type, Cell line, Drug. While the dataset-level mappings can be used to narrow down a dataset of interest, sample-level mappings directly describe the biological characteristics of the sample. For instance, if a sample is labeled with a drug, it means that that drug was used to treat the sample. On the other hand, if a dataset is tagged with a drug it doesn’t necessarily mean that the samples were treated with that drug, only that it was mentioned somewhere in the description of the study.
All sample-level annotations are stored in the GCT as shown below.
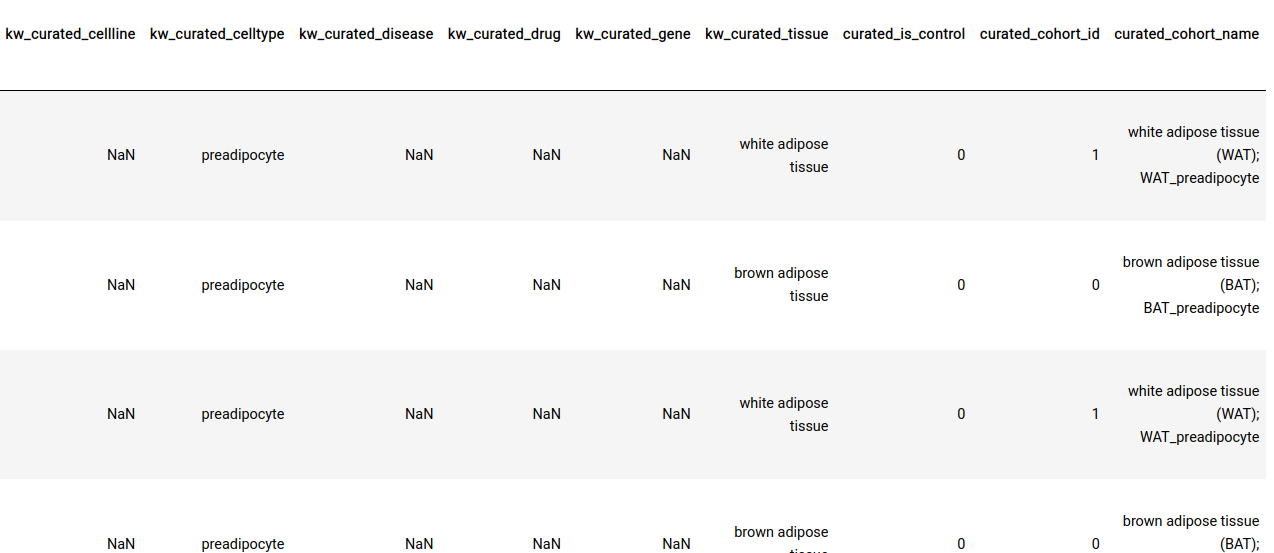
Perturbation/control identification: In addition to ontology mappings we also have the following three annotations at the sample-level.
-
curated_is_control: This indicates whether the sample is a control or a perturbation sample within the context of a particular experiment.
-
curated_cohort_id: Indicates the cohort that the sample belongs to. Samples within the same cohort have the same value for this field
-
curated_cohort_name: This is a short textual description of the cohort. It tries to capture sample properties that are exclusive to the samples within a cohort.
These labels are present for most datasets and are useful when performing certain downstream analyses (like Differential Expression) on a large number of datasets in an automated fashion. These annotations also address the FAIR metrics R1.2 (see here for more details).
Manual curation of perturbation/control labels: To do this perturbation/control classification we use a machine learning classifier that uses the textual metadata associated with each sample to classify it as control or perturbation. To train this classifier and improve its accuracy on different types of omics datasets, we manually curate these labels for a subset of the datasets in our data lake. This manual labeling is done by graduate and undergraduate students who are well versed in understanding biological data generation. We use these manually annotated datasets to train our classifier and improve its accuracy. The current classification model has an accuracy of ~90% on sample metadata for transcriptomics datasets.